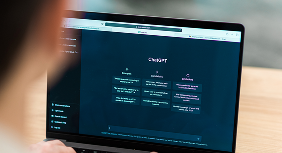
Our data visualization expertise helps businesses from all sectors interpret and utilize their data effectively.

arrow-leftarrow-left
arrow-rightarrow-right

Operational Analytics

We develop real-time monitoring solutions that track operations, efficiency, and productivity.

AI-Driven Financial Data Visualization

We provide financial institutions with analytics tools that visualize trends, risk factors, and investment opportunities.

Healthcare Data Dashboards

We build medical data visualization tools that assist in patient tracking, diagnostics, and medical research.

Retail & E-Commerce Data Visualization

We create visual analytics that helps retailers optimize sales strategies, customer behavior analysis, and supply chain management.

Data Analytics for Process Optimization

We design real-time dashboards that provide visibility into production lines, fleet management, and logistics planning.

AI Social Media & Marketing Analytics

We build tools that analyze campaign performance, audience engagement, and customer sentiment in real-time.

We utilize intelligent visualization techniques to convert complex data into clear, actionable insights for informed decision-making.

Live Data

Real-Time Data Visualization for Insights

We implement real-time dashboards that update instantly, enabling businesses to track performance and trends as they happen.

AI Driven Analytics

AI-Enhanced Data Analysis & Recognition

We use AI algorithms to uncover patterns and trends in large datasets, improving decision accuracy and forecasting.

Smart Dashboards

Custom Dashboards for KPI Tracking

We create tailored dashboards that consolidate key performance indicators (KPIs), streamlining reporting and analytics.

Location Intelligence

Geospatial Mapping Solutions

We develop location-based analytics tools, helping businesses analyze geographic data for logistics, sales, and planning.

Automated Analytics

AI-Powered Automated Data Reports

We generate AI-driven reports that summarize complex data, reducing manual work and improving efficiency.

Visual Narratives

Data-Driven Storytelling for Reports & Presentations

We transform raw numbers into compelling visual stories, making it easier to communicate insights across teams.

Shadow Top
our tech suiteour tech suite

Advanced Tools We Utilize for Data Visualization

We integrate industry-leading tools to provide high-performance, real-time analytics for businesses.

Power BIBusiness Intelligence

Power BI

We create dashboards that display critical data interactively and clearly.

Data AnalyticsGoogle Looker

Data Analytics

We create Google analytics platforms for live tracking and insights into data.

Chart.jsData Visualization

Chart.js

We use JavaScript to create engaging data charts and reports.

SeabornData Science

Seaborn

We use Python’s visualization libraries for advanced graphs and analytics.

GrafanaMonitoring

Grafana

We deploy open-source visualization tools for monitoring key metrics in real-time.

Google Cloud AIMachine Learning

Google Cloud AI

We use cloud analytics tools to help businesses visualize and act on data.

Shadow Top

Our advanced visualization techniques improve data interpretation, operational efficiency, and strategic planning.

Real-Time Insights for Faster Decision-Making

Our live dashboards enable instant tracking and analysis, helping businesses make agile, informed decisions.

98%

AI-Optimized Data Processing & Trend Analysis

We integrate AI into analytics, making it easier to identify patterns and forecast future trends.

96%

Custom Dashboards for Specific Use Cases

We build flexible, industry-specific dashboards that simplify data analysis for diverse business needs.

94%

Enhanced Business Intelligence through Automation

We eliminate manual reporting inefficiencies by automating analytics and summarizing key insights.

93%

Scalable Visualization for Data Needs

We provide enterprise-level solutions that scale with increasing data volumes and evolving business goals.

91%

AI-Driven Customer Behavior & Sentiment Analysis

We analyze consumer interactions and feedback to enhance engagement and customer experience.

90%
arrow-leftarrow-left
arrow-rightarrow-right
Seamless ExperienceSeamless Experience

Revolutionizing Data Analytics with Accurate Data Visualization

We help businesses process, visualize, and act on their data more effectively with state-of-the-art solutions.

arrow-leftarrow-left
arrow-rightarrow-right
Image

Data Consolidation & Multi-Source Analytics

We aggregate data from multiple sources into a single, interactive platform for better decision-making.

Image

Predictive Analytics & AI-Driven Forecasting

We build predictive models with advanced visualization tools to anticipate market shifts and operational changes.

Image

Interactive Data Exploration for Enterprise Users

We enable users to manipulate and explore data visually, uncovering hidden patterns and insights.

Image

AI-Powered Anomaly Detection & Risk Analytics

We deploy visualization tools that detect outliers and irregularities in financial, security, and business operations.

Image

Cloud Data Visualization for Accessibility

We implement cloud-native visualization solutions for seamless collaboration and real-time data access.

Image

Automated Alerts & Notifications for Data Insights

We develop AI-driven alert systems that notify stakeholders about critical data trends and anomalies.

Awards That Speak for Our Excellence

We are recognized for our excellence in secure, innovative, and high-quality web development solutions.

Customer Satisfaction 2024Achievement in

Customer Satisfaction 2024

Mobile App Development 2024Achievement in

Mobile App Development 2024

Most Reliable Company 2023Achievement in

Most Reliable Company 2023

Reliable Company 2022Achievement in

Reliable Company 2022

Customer Satisfaction 2022Achievement in

Customer Satisfaction 2022

Software Development 2021Achievement in

Software Development 2021

Informative blogsInformative blogs

Latest New and Insights into Our Transformative AI

blog-img-1
4 mins read

How AI Is Transforming Secure Software Development

blog-img-1
5 mins read

AI-Powered Threat Detection: Smarter Security for Smarter Code

blog-img-1
5 mins read

Using Machine Learning to Spot and Fix Code Vulnerabilities

blog-img-1
4 mins read

Can AI Write Secure Code? Here's What You Need to Know

blog-img-1
5 mins read

AI vs Hackers: How Artificial Intelligence is Raising the Security Bar

blog-img-1
5 mins read

Secure Coding Standards: What They Are and Why They Matter

blog-img-1
5 mins read

How to Build a Culture of Secure Coding

blog-img-1
5 mins read

Code Review for Security: A Step-by-Step Guide

FAQsFAQs

Frequently Asked Questions

Data visualization simplifies complex information, helping businesses identify trends, track performance, and make informed decisions.